What Every Programmer Should Know About Memory, really
After 11 months of procrastinating I finally got around to reading “What Every Programmer Should Know About Memory”. It was on my list of opened Firefox tabs this whole time and I decided on a whim to print it, read it and take notes in the process. I powered through 110 pages so you don’t have to!
Below are the takeaways and key concepts that I found interesting or worth keeping a reference to. Keep in mind that “What Every Programmer Should Know About Memory” was published in 2007 and not revised since. I tried to update the advice or links when I found it necessary. Let’s go.
Glossary
- ALU: Arithmetic Logical Unit
- ASLR: Address Space Layout Randomization
- CAS: Column Address Selection
- CAS: Compare-and-Swap
- CPI: Cycles Per Instruction
- CPU: Central Processing Unit
- DCA: Direct Cache Access
- DDR SDRAM: Double Data Rate, Synchronous DRAM
- DDR1/DDR2/DDR3: marketing names for different types of Double Data Rate RAM
- DMA: Direct Memory Access
- DRAM: Dynamic RAM
- DSO: Data Shared Object
- EPT: Extended Page Tables (Intel)
- FB-RAM: Fully Buffered RAM
- FSB: Front Side Bus
- IPC: Instructions Per Cycle
- IPC: Inter-Process Communication (depends on context!)
- L1d: Layer 1 data (cache)
- L1i: Layer 1 instruction (cache)
- LL/SC: Load Link/Store Conditional
- LRU: Least Recently Used
- MESI: Modified Exclusive Shared Invalid (protocol)
- MMU: Memory Management Unit
- NPT: Nested Page Tables (AMD)
- NUMA: Non-Uniform Memory Architecture
- RAM: Random Access Memory
- RAS: Row Address Selection
- RFO: Request For Ownership
- RISC: Reduced Instruction Set Computer
- SATA: Serial Advanced Technology Attachment
- SDR SDRAM: Single Data Rate, Synchronous DRAM
- SIMD: Single Instruction Multiple Data
- SMC: Self-Modifying Code
- SMP: Symmetric Multi Processor
- SMT: Symmetric Multi-Threading (aka “hyperthreads”)
- SRAM: Static RAM
- SSE: Streaming SIMD Extensions
- TLB: Translation Lookaside Buffer
- TLS: Thread Local Storage
- USB: Universal Serial Bus
- VMM: Virtual Machine Manager
- dTLB: Data Translation Lookaside Buffer
- t(RCD): time(RAS-to-CAS Delay)
- t(RP): time(RAS Precharge)
Computer architecture
In standard architectures CPUs load values and write to physical memory (RAM) through the FSB and the Northbridge. The Southbridge is known as “the I/O bridge” and handles communications to USB, SATA, etc.
DMA is a way for the southbridge to store value into RAM without the intervention of the CPU, and without clogging the FSB. This is really important to handle long I/O transfers without involving the CPU.
For computers with more than 1 CPU, the memory controllers are sometimes integrated into the CPU, resulting in an architecture where each CPU has its own RAM attached to it. Because the access time from CPU1 to its attached memory and access time from CPU1 to CPU4’s attached memory differ, this architecture is called NUMA (Non Uniform Memory Architecture.)
The “NUMA factor” is the extra time needed to access remote memory.
RAM
Computer memory (RAM) is made out of transistors and capacitors. Transistors are electronic components acting like switches (they’re either “open” i.e. not conducting, or “closed” i.e. conducting). Capacitors are components storing energy (they’re either “0” i.e. empty or “1” i.e. full)
These transistors and capacitors are organized into memory cells.
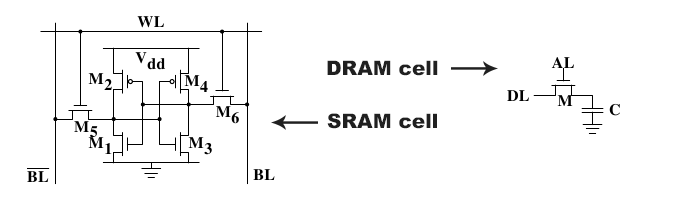
A cell of SRAM (static RAM) involves multiple capacitors/transistors. A cell of DRAM (dynamic RAM) is made of a single transistor/capacitor pair:
Since SRAM is more complex it is more expensive. But it’s much more stable than DRAM. Usually computers have SRAM for CPU caches and DRAM for main memory.
Something worth noting: DRAM needs to be periodically refreshed (data is read and written back immediately) to prevent capacitor charges from decaying. Because of these periodical refreshes some cache data is made unavailable and this causes delay if they’re accessed during refresh cycles.
DRAM access:
- Memory controller makes the row address available on the address bus (RAS)
- Signals are read
- Memory controller makes the column address available on the bus (CAS)
- Cache line is read and data gets out of the RAM chip
The timing of these steps is determined by the frequency of the clock and the characteristics of the RAM chip. In particular:
- DDR1 uses both up and down edges of the signal to transmit data, without changing clock frequency. It has an I/O buffer between the DRAM cell array and the output signal (“double-pumped” address bus)
- DDR2 doubles the frequency of the I/O buffer and output signal (“quad-pumped” address bus)
- DDR3 quadruples the frequency of the output signal and has an 8bit I/O buffer
CPU cache architecture
CPU caches are made of SRAM. Why are CPU caches a good idea?
- spatial locality: it’s likely that two pieces of data/code located close to each other will be used together
- temporal locality: two pieces of data/code used at a given time are likely to be reused again soon
Typically the size of a CPU cache is 3 orders of magnitude lower than the main memory. For 4GB of DRAM, the CPU cache would be 4MB.
CPUs have multiple layers and types of cache:
- L1d: Layer 1 data cache
- L1i: Layer 1 cache, can contains either the raw bytes of instructions (“instruction cache”), or the decoded instructions (“trace cache”)
- L2: Layer 2 cache (usually unified, i.e. can cache data and code)
- L3: Layer 3 cache (ditto)
CPU cores are almost entirely independent, but CPU threads are NOT independent. They share almost everything including registers and caches.
Concept of a word: it’s the smallest unit of memory, and natural unit of data used by the CPU. It’s usually 32-bit or 64-bit, depending on the architecture. Hear all that fuss about “64-bit binaries”? That’s why.
Concept of a cache line: usually 64 bytes or so.
Exclusive cache architecture: data is in L1d or L2, but not in both. This leads to faster cache line writes to L1d (no need to populate L2!)
Inclusive cache architecture: data is in L1d and L2. This leads to faster eviction from L1d, because the content doesn’t have to be written to L2 when it’s done. The data is already in L2. That’s at the expense of slower writes to L1d.
Multi-Processor caches
SMP architecture: CPU caches do not work independently from each other, and work to maintain a consistent view (“cache coherency”). To make that happen the MESI protocol is used between the different CPU units. This ensures that dirty cache lines (lines that are written to by a CPU) aren’t present in any other cache, and that clean cache lines (read-only lines) can be shared between as many caches as needed. The concept is a bit similar to Readers-Writer Locks.
The MESI protocol is a state machine applied to each cache line. Each line can be in one of 4 states: Modified (cache line is dirty and present in only one cache), Exclusive (cache line is clean and exclusively present in one cache), Shared (cache line is clean and present in multiple caches) and Invalid (cache line is unused). To request ownership over a given cache line (S to E transition for example) RFO messages are sent from core to core, causing potential delays.
Whenever possible a program should minimize accesses from different processors and core to the same memory locations!
Writing programs that take advantage of parallel processors is hard because the underlying hardware has a shared, constrained resource: the bus from the CPU to memory. Programs which cannot use CPU caches effectively perform poorly and deplete this precious resource.
Cache Associativity
A cache is fully associative if all cache objects can be associated with any cache entry. This leads to a better cache utilization, at the expense of slow lookups. For a 4MB cache with 64B cache lines that’s already 65536 entries to check. This makes cache lookup too slow (remember we’re talking about L1d, where single-digit numbers of CPU cycles matter!).
The opposite of a fully associative cache is a direct-mapped cache, where each cache line has a cache entry already mapped to it. This way lookups are really fast, there’s only one entry to check. Of course this means the cache isn’t well utilized.
In practice caches use a mix of both. A cache line is directly mapped to a set. Within that set the cache is then fully associative. Hence “set-associative caches”. An “8-way set associativity” means that the cache is split in sets of 8 entries for example.
The concept of conflict misses refers to when two cache objects belong in the same set. Storing one in the cache will cause eviction of the other regardless of the state of the cache (there might be plenty of space!).
Cache writes policies
- Write-through cache: when data is modified in the cache, main memory is updated at the same time
- Write-back cache: cache lines are marked as “dirty” on write, and lines are written to main memory only when the cache line is evicted. This performs better is memory isn’t shared between processes
- Write combining cache: cache lines are committed to main memory in batches. This is a really popular method for graphic cards.
When writes aren’t possible because the cache is full, most CPU caches use LRU to evict entries and make space for new data.
Self-Modifying Code
Self-Modifying Code (SMC) is to avoid at all cost since CPUs make the assumption that code pages are immutable. SMC is very hard to produce anyway.
Hyperthreads
Hyperthreads (also known as SMTs) are a way to allow time-sharing of the ALU. Basically, when one hyperthread is blocked on I/O (busy accessing memory, say), the other hyperthread can use the ALU to make progress.
Hyperthreads share all CPU resources and registers.
Critical Word Load & Early Restart
Critical Word Load & Early Restart is a technique to fetch a word in a cache line so that the CPU is unblocked as fast as possible.
Virtual Memory
A virtual memory page is a continuous block of virtual memory. Generally 4096 bytes.
    #include stdio.h
    #include unistd.h

    int main(void) {
        printf(
            "The page size for this system is %ld bytes.\n",
            sysconf(_SC_PAGESIZE)
        );
        return 0;
    }
How is virtual memory mapped to physical memory? Virtual memory addresses are 32-bit (or 64-bit) values which point to a precise bit on a page.
The page directory is stored in main memory at a predefined place (a special register). A virtual address has 2 parts: the directory, and the offset. The directory part of the address is used as a key in the page directory. This gives the physical page. Then the offset is used to locate the precise bit the virtual address points to.
Usually there are multiple page directories, and virtual addresses have multiple levels of indices. The process of converting the virtual indices into a physical page index is called page tree walking.
TLB caches
TLB caches contain the result of page tree walking. Each entry is a mapping of a virtual index to a physical index. Usually there are more than one TLB cache. dTLB cache is used for data, iTLB for instructions, and L2TLB to minimize misses of both dTLB and iTLB caches.
The cost of a TLB cache miss is a page tree walk. Since TLB cache entries apply to a whole memory page, a lot of addresses benefit from one TLB cache entry (as many as fit on one page)
TLB caches need to be flushed when memory pages are re-mapped (typically during
process context switches, calls to munmap, etc). Note that
smart invalidation is possible: if the current process has a non-overlapping
virtual memory space with the process about to be scheduled on the CPU, no need
to flush TLB cache entries! A further optimization is to use process
identifiers such that frequently used context switches do not cause TLB cache
misses even when their virtual memory space overlaps (think process -> kernel
-> process swaps.)
Virtualized memory
VMMs create their own page table trees (“shadow table tree”). This prevents faulty/rogue access by guest kernel to physical memory (only the host VMM has access to true physical memory), at the cost of another page tree walk, potentially. Be really care ful when touching memory mapping from a guest OS, it’s likely more expensive!
To work around this AMD and Intel have both come up with optimizations to make VMM memory consumption go down and avoid host page tree walks: EPT and NPT are both there to make end-to-end address translations cacheable (guest virtual address all the way to host physical address)
NUMA
Why NUMA? To get rid of the Northbridge as a bottleneck to access memory (in NUMA each CPU has its own dedicated connection to memory.)
With NUMA processes get their memory allocation randomly split between the different memory nodes (“striping”). This makes it easy to migrate processes and mitigate the effect of processes consuming a large amount of memory. Also, memory is consumed equally across processor regions with striping.
A process can select a different strategy for itself and its children. This is called NUMA pinning. See numactl.
An alternative strategy to pin tasks to a given set of CPUs and memory nodes
without having to modify their code is cpusets. mount -t cpuset none /dev/cpuset will create a special filesystem with cpus, mems and tasks
files in each folders. To create a new set, just create a new directory and
edit tasks to schedule tasks onto that set. More at cpusets.
CPU cache topology
The cache topology is available at:
/sys/devices/system/cpu/cpu*/cache/index*/type,level,maps/sys/devices/system/cpu/cpu*/cache/index*/level/sys/devices/system/cpu/cpu*/cache/index*/maps/sys/devices/system/cpu/cpu*/topology/physical_package_id/sys/devices/system/cpu/cpu*/topology/core_id/sys/devices/system/cpu/cpu*/topology/thread_siblings/sys/devices/system/node/node*/cpumap/sys/devices/system/node/node*/distance/proc/$PID/numa_mapsshows the memory page allocation per processor
Non-temporal hints
If a programmer knows that some data or code isn’t going to be reused, they can
give hints about this through intrinsics (functions build into the compiler
and inlined into the code depending on the architecture). See the Intel
docs and the associated GCC header file,
intrinsics like _mm_stream_si32 let you stream data directly to the CPU
without populating caches. This is called a non-temporal hint.
Optimizing data cache access
Make use of loaded cache line effectively! If you load data, use as much of it as possible. Avoid loading a cache line just to read one bit of it. This means:
- Pack structures so that they fit onto as few cache lines as possible.
- Fit data that’s likely to be used together close together, and if possible on the same cache line
Tool to help with structure packing: pahole.
As a programmer, try to move the critical structure elements to the beginning, and when accessing structure fields, access them in the order in which they’re defined.
When possible, tuning structures for better memory alignment can help so that
they aren’t accidentally spanning two cache lines when they could fit on one.
To do this, use GCC’s aligned attribute or
posix_memalign. The tradeoff here is that alignment makes
the program’s overall footprint go up.
If structures are big, it helps to split them into smaller structs before loading them into memory to make better use of CPU caches (e.g. if a loop uses a couple of fields for an array of items, make sure the items are as slim as possible, ideally containing just the fields needed for the loop logic.)
Optimizing instruction cache access
The killer for L1i is unpredictable branches/jumps because CPU execution pipelines rely heavily on branch prediction.
If code executes well without causing a delay in the execution pipeline it’s said it’s executed “without bubbles”. While in practice hard to hand-tune L1i usage can be made better.
Reducing the code footprint as much as possible is always good. This has to be
balanced with optimizations like loop unrolling and inlining. Relevant GCC
options: -O2 (optimize), -O3 (optimize harder!), -finline-limit (to set
the limit beyond which functions should not be inlined)
Code execution should be as linear as possible and as predictable as possible.
It’s possible to tell the compiler which branches are more likely to occur with
__builtin_expect. GCC can then reorder blocks based on
branch prediction with -freorder-blocks.
Code alignment can help as well. -falign-functions, -falign-jumps, and
-falign-loops can do this automatically, but this is a trade-off between
execution speed and memory footprint.
Optimizing TLB usage
At a high level:
- Reduce number of TLB misses
- Minimize the number of TLB directories
Optimizing TLB usage thus means minimizing the number of pages that a program uses and minimizing the number of page faults.
What’s a page fault? When a process attempts to access a memory location unmapped in the MMU (hence uncached in the TLB cache). This can either be a soft page fault of a hard page fault. More about page fault here.
An extreme optimization to perform to improve TLB usage is to disable ASLR so that the load addresses of the program’s stack, DSOs and heap are more predictable. This has obvious security implications and is a bad idea generally speaking.
Optimizing memory allocations
When a program needs to allocate memory for many small objects, avoid
allocating memory in small chunks. Instead, allocate in bulk with
obstack.
It’s also important to minimize page faults if possible. A tool to analyze when
page faults occur is pagein. If you know some memory pages will be
needed soon it’s possible to use nmap with MAP_POPULATE to pre-fault the
pages in and pay the latency cost upfront.
It’s also possible to tell the OS that a page will be needed soon with
madvise (POSIX_MADV_WILLNEED). This offers more granularity than
nmap with MAP_POPULATE (calls to nmap usually allocate more than 1 memory
page!)
Yet another option to reduce page faults is the use bigger page size! It can be
wasteful because memory is more likely to go unused. So it’s best to use larger
page sizes only for big memory allocations. hugetlbfs is a special file
system containing huge pages ready to be allocated. The number of huge pages
available can be tuned with /proc/sys/vm/nr_hugepages. When using a VMM, the
guest OS doesn’t have control over the physical memory. A solution is to use
shmget (System V shared memory) with SHM_HUGETLB and a length set
to be a multiple of the host’s huge page size. Sometimes the host mounts a
hugetlbfs for guests. That’s preferable.
Prefetching
Hardware prefetching is controlled by the CPU and kicks in when 2 or more misses in a row are seen. Some more complex patterns are recognized depending on the CPU and architecture, but the gist is that hardware prefetching is hard to tune. It’s also important to realize that hardware prefetching cannot go over page boundaries. It’d be unacceptable for a program to experience prefetch-induced page faults. What if the prefetcher is wrong and tries to page-in a chunk of memory that isn’t owned by the program?
Programmers can give hints such that memory is prefetched through software.
This is done with GCC's __builtin_prefetch. A value of 0
means “don’t keep in the cache”, 1 means “load into L3, if present”, 2 means
“load into L2” and 3 means “load into L1” (default).
To optimize a program with prefetching:
- look at cache misses
- if it’s high, add prefetch builtins one at a time
- look at prefetch and cache miss counters to see if that’s effective
GCC has -fprefetch-loop-arrays to autofetch loop arrays, but it can hurt more
than it helps. Measure carefully!
To avoid manually adding prefetch hints it’s possible to tell GCC to add them automatically:
- Compile with
-fprofile-generate(outputs a.gcnofile) - Run the output with a representative workload (that’s hard, but the more
accurate the workload, the better the generated prefetches will be!). This
outputs a
.gcdafile - Compile the program again with
-fprofile-use <gcda file>
A common pitfall when using prefetching is that the code becomes hard to read
and maintain. For this “helper threads” are a good solution. They’re
hyperthreads that are synchronized with the main program (with futex
or POSIX thread synchronization primitives), and
their only role is to perform prefetching such that other threads make progress
as fast as possible.
To schedule helper threads libnuma can be used to pin them to their own hyperthread.
Speculation is a special sort of prefetch, very low level. The idea is to execute instructions ahead of time even though the result might not be needed. It’s not widely available but it has the advantage of loading the data directly into registers. It’s completely transparent to the programmer and so low-level that it’s not available for tuning.
Direct Cache Access
DCA is a way for I/O to be written directly into L1d. A common use case is the handling of ethernet packets. DCA enables packets to be stored in the cache such that when the OS handles the associated interrupts the data is there ready to use and already available in the cache.
Optimizing Multi-threaded programs
In a threaded application be aware of the overhead of writing to the same cache line from different threads. If this happens a lot of RFOs are sent back and forth between the different CPUs, which leads to unnecessary delays.
It’s possible to give hints to segregate data with GCC’s section
attribute. It’s also possible to enforce that data is made
available for each thread with TLS through __thread,
aka thread-local storage.
    // `bar` is isolated in a ".data.ro" section
    int bar __attribute__((section(".data.ro"))) = 42

    // Allocates a segment with this data **for each thread** (TLS)
    __thread int bar = 42
General optimization advice:
- Separate read-only from read-write variables with
__attribute__((section(...))) - Group read-write variables which are used together in
structs - Move read-write variables which are often written to onto their own cache
line (this means adding padding where necessary with
__attribute__((aligned(...))) - If a variable is used by multiple threads, move it to TLS.
Even without contention for access to the same cache line, parallel threads can still cause a slowdown because the connection to memory is shared between all cores and hyper-threads.
If there’s contention for bandwidth to access memory, it’s possible to optimize
this by scheduling threads touching the same data set on the same CPU and
scheduling threads touching distinct data sets on different CPUs. This leads to
better CPU cache utilization, and ultimately less FSB traffic. To schedule
threads or processes on specific CPUs/cores, their affinity can be adjusted
through sched_set_affinity (for processes) and
pthread_setaffinity_np (for threads).
In addition to adjusting affinity it’s good to tune the memory policy to make
sure pages are pinned to the right set of nodes. See memory
policies (MPOL_BIND, MPOL_PREFERRED, MPOL_INTERLEAVE,
MPOL_DEFAULT), set_mempolicy and mbind to tune
this.
When getting information about memory nodes and places where tasks are run
it’s crucial to be aware that this information is transient and can change
without notice! For instance don’t use sched_getaffinity and use this
information throughout a process’s lifetime to make optimizations.
Atomicity
There are 4 types of atomic operations implemented by CPUs:
- Bit test/set/clear instructions (see the bit instruction set)
- LL/SC: Load Link/Store Conditional is a pair of instructions. The first one (“Load link”) loads a value from a memory address and stores its value in a special register. The second (“Store Conditional”) issues a write only if the initial memory address wasn’t touched (this is determined based on the value in the special register.
- CAS: Compare-and-Swap is equivalent to LL/SC but is done in a single
instruction:
CAS(pointer, known_val, new_val)compares the value ofpointeragainstknown_val(the value known to this thread). If and only if the pointer points toknown_val, then it’s set to benew_val. If another thread touches the memory location pointed to bypointerthe write fails. CAS is a more modern version of LL/SC. - Atomic arithmetic instructions: while possible to implement any kind of
atomic arithmetic instructions with CAS and/or LL/SC, it’s slow. Some CPUs
have built-in atomic arithmetics. Use GCC’s
__atomic_*for this.
There is still a problem with standard CAS-based operations called the “ABA problem” because CAS uses “the value is the same” as a signal for “nothing has happened”. That’s wrong.
Transactional memory is a solution to this. The concept is similar to database transactions, and implemented with the help of a transactional cache. The main difference between atomic operations and transactional memory is that the former has to write to main memory to guarantee atomicity. The latter doesn’t as long as the transaction cache is sufficiently large. This means atomic operations are likely to be significantly faster.
One gotcha: the transactional cache is an exclusive cache, so data that isn’t needed by a transaction should be moved to a different cache line (otherwise writing to this seemingly unrelated data will cause the transaction to fail.)
Performance tooling
To identify bottlenecks, use CPI (Cycles per instruction) or IPC (the reverse) instead of raw “instructions retired” counters. Ratios are usually much easier to analyze.
To query resource usage of a task:
getrusagegets execution time, IPC messages, minor and major faults and more.- The
procfilesystem exposes tons of useful stats at/proc/<PID>/stat
To simulate CPU caches: valgrind --tool=cachegrind (see cachegrind)
To analyze memory usage: valgrind --tool=massif (see massif), or
memusage <program> <args> (see memusage)
Aside on stacks: signalstack is a function to let programs use
an alternative stack during signal handling. A thread stack is typically
allocated by parents through nmap so it can be allocated anywhere. So it’s
not always possible to capture the full program’s memory usage with tools like
massif which need the valgrind runtime to know about stack limits.
Acknowledgements
Although I’m here laying out the key concepts and takeaway, you should really go read the original document if what is explained above seems interesting. Ulrich Drepper does a fantastic job being as terse as possible when explaining fundamental concepts related to CPUs, caches and memory. The document is well-balanced, nicely structured, and one of the few examples of long papers actually worth reading.