Hacking San Francisco Hills
So What Are We Building?
I live in San Francisco. I like living in this city and I walk a lot. San Francisco has a special feature: its hills. They can be as steep as 30% in parts of the city.
I find it pretty frustrating to look at Google Maps not knowing where the hills are so I wanted an overlay that would color code street blocks according to their steepness.
First Idea: Heatmap Of Elevation
My first idea to get the result I wanted was to retrieve the elevation of all possible points in San Francisco to generate a heat map that I would overlay on top of Google Maps. Google has a nifty feature that lets you use Table Fusion to build Maps layers. However they won’t let you read more than 100,000 rows per request/layer.
I wanted to cover the whole city. In other words, I wanted an evenly distributed cloud of points within SF. To get the coordinates of the ~100,000 points I needed, I wrote a quick Python script:
    ### SF City in a box?
    # 37.811038,-122.477778 <= Northernmost point, Golden Gate Bridge
    # 37.778669,-122.514428 <= Easternmost point, Cliff House near Ocean Beach
    # 37.704739,-122.442899 <= Southernmost point, before San Bruno mountain park begins
    # 37.728731,-122.357017 <= Westernmost point, at Hunters point
    from __future__ import division

    =====================

    >>> max_lat = 37.811038
    >>> min_lat = 37.704739
    >>> min_lng = -122.514428
    >>> max_lng = -122.357017

    =====================

    >>> lat_step = (max_lat - min_lat) / 300
    0.0003543300000000234
    >>> lng_step = (max_lng - min_lng) / 300
    0.0005247033333333206

    =====================

    >>> lat_list = [min_lat + i*lat_step for i in range(301)]
    >>> lng_list = [min_lng + i*lng_step for i in range(301)]
    >>> lat_lng_pts = [(lat,lng) for lat in lat_list for lng in lng_list]

    >>> len(lat_lng_pts)
    90601
lat_lng_pts is the list of (latitude, longitude) we’re interested in. Next step: retrieve the altitude for every points we got. That’s where the USGS dataset comes in handy. The USGS API supports simple GETs. For instance:
    GET /xmlwebservices2/elevation_service.asmx/getElevation?X_Value=lng&Y_Value=lat&Elevation_Units=METERS&Source_Layer=NED.CONUS_NED_13W&Elevation_Only=TRUE HTTP/1.1
    Host: gisdata.usgs.net

    HTTP/1.1 200 OK
    Content-Type: text/xml; charset=utf-8
    Content-Length: length


    56.2435
Now, “METERS” could be “FEET”, but I prefer the metric system so here you go.
The weird “NED.CONUS_NED_13W” param corresponds to the Western part of the US (see this table for more possible params). And the Elevation_only param tells that we care about the elevation only. The response will be a simple number, wrapped in XML.
Now, back to our Python shell:
>>> import urllib2, sys
>>> def scrape(lat_lng_pts, filename):
>>> f = open(filename, "a")
>>> for (lat, lng) in lat_lng_pts:
>>> resp = urllib2.urlopen("http://gisdata.usgs.net/xmlwebservices2/elevation_service.asmx/getElevation?X_Value=" + str(lng) + "&Y_Value=" + str(lat) + "&Elevation_Units=METERS&Source_Layer=NED.CONUS_NED_13W&Elevation_Only=TRUE&Elevation_Only=TRUE")
>>> data = resp.read()
>>> elevation = data.split("")[-1].split(" ")[0]
>>> f.write(str(lat) + "|" + str(lng) + "|" + elevation + "\n")
>>> sys.stdout.write(".")
>>> f.close()
>>> scrape(lat_lng_pts, "elevation-data.csv")
.
.
.
=== Some time passes by...actually, a few hours ===
.
.
.
Once I created the CSV, I imported it into a brand new Google Fusion Table.
A few tricks:
- the longitude and latitude columns are set to “location” type, which enables easier integration with Google Maps further down the road.
- don’t be afraid to delete and import the data again. Since Google Fusion Table is kinda new, it can be buggy, especially with large datasets
- I deleted the bad points (various very negative elevations)
What I originally envisioned was a heatmap-like visualization, where the high areas would be red, while the lower ones would be green. It appears that heatmaps are only possible with density data…so…no Fusion Table Heatmaps for me. Not this time.
Plan B: use a standard Fusion Table layer, with a custom, semi-transparent overlay to let the map shine through. Easy you say?
Not quite (seems I can’t have a transparent png as my custom marker). In this issue, there’s a workaround which involves using the Fusion API directly, but I didn’t try it out.
Say I somehow managed to make it work, the current approach has the following flaws:
- The geocoded points aren’t aligned with the roads at all, which can be a problem in some cases
- More importantly, the current visualization simply gives an idea of the absolute elevation, which doesn’t tell if a street is steep or not.
The result I have so far is not that bad, but not what I have in mind.
Looks like a perfect time to step back to think again.
A New Battleplan
I decided to stay within Google’s environment by leveraging the Elevation and Geocoding APIs.
The Geocoding API will transform information like “Market and 3rd, San Francisco, CA” into (latitude, longitude) points. The elevation API will then tell the elevation of a certain (lat, lng) point.
This should give me a matrix of (alt, lng, elevation). Another advantage of the “cross-street-only” approach: it will reduce the number of points we will work with. We’ll have a 100x100 matrix, which gives us approximately 10,000 points to work with, instead of 90,000 before.
Finally, I’ll draw lines from one crossing to another using polylines. They will be colored from green to red depending on how steep the current street portion is.
Let’s break down the problem into smaller bits:
- Get the data about the street crossings in San Francisco. Since there’s no such data available directly, we’ll manually create a JSON file containing these.
- Take each crossing, geocode it, and retrieve the altitude.
- Compute the elevation difference between this crossing and it’s closest neighbors.
- Generate the polyline with the appropriate color, reflecting the steepness of the path
Now that we have this battleplan, let’s proceed, step-by-step.
Gettin' the data
I decided to go with a brute force approach. I statically declared all street crossings in a file and ran a batch over it to retrieve the geocoordinate of a crossing (via Google’s Geocoding API) and the elevation of those coordinates via Google’s Elevation API.
Static street crossing declaration looks like:
    var streetCrossings = {
      "Lyon St": ["Bay St", "Francisco St", "Chestnut St", "Lombard St", "Greenwich St", "Filbert St", "Union St", "Green St"],
      "Lyon St.": [
        "Broadway", "Pacific Ave", "Jackson St", "Washington St", "Clay", "Sacramento", "California", "Pine", "Bush St", "Sutter St",
        "Post St", "Geary Blvd", "O'Farrell"],
      "Lyon St..": ["Turk St", "Golden Gate Ave", "Mc Allister St", "Fulton St", "Grove St", "Hayes St", "Fell St"],
      "Lyon St...": ["Oak St", "Page St", "Haight St"],
      ...etc...
    }
Then I wrote the batch to geocode crossings and retrieve their elevation in JS. It looks like this:
      // Geocode the address, and create a new marker and InfoWindow at the geocoded location
      function geocodeCrossing(streetY, streetX) {
        var address = streetY + ' and ' + streetX + ', San Francisco, CA';
            lat=null, lng=null;

        console.log('Now geocoding: ' + address);

        geocoder.geocode( { 'address': address }, function(results, status) {
          if (status == google.maps.GeocoderStatus.OK && results[0]) {
            console.log('Latitude: ' + results[0].geometry.location.lat());
            console.log('Longitude: ' + results[0].geometry.location.lng());

            lat = results[0].geometry.location.lat();
            lng = results[0].geometry.location.lng();

            // Now, retrieve the elevation
            elevationRequest = {'locations': [results[0].geometry.location]}
            elevator.getElevationForLocations(elevationRequest, function(results, status) {
              if (status == google.maps.ElevationStatus.OK && results[0]) {
                // Function that puts the geocoded intersection in memory
                insertData(streetY, streetX, lat, lng, results[0].elevation);
                console.log('Altitude: ' + results[0].elevation);
              } else {
                alert("Elevation service failure: " + status);
              }
            });

          } else {
            console.log("Something went wrong when trying to geocode " + streetX + ',' + streetY+ ': ' + status);
          }
        });
      };
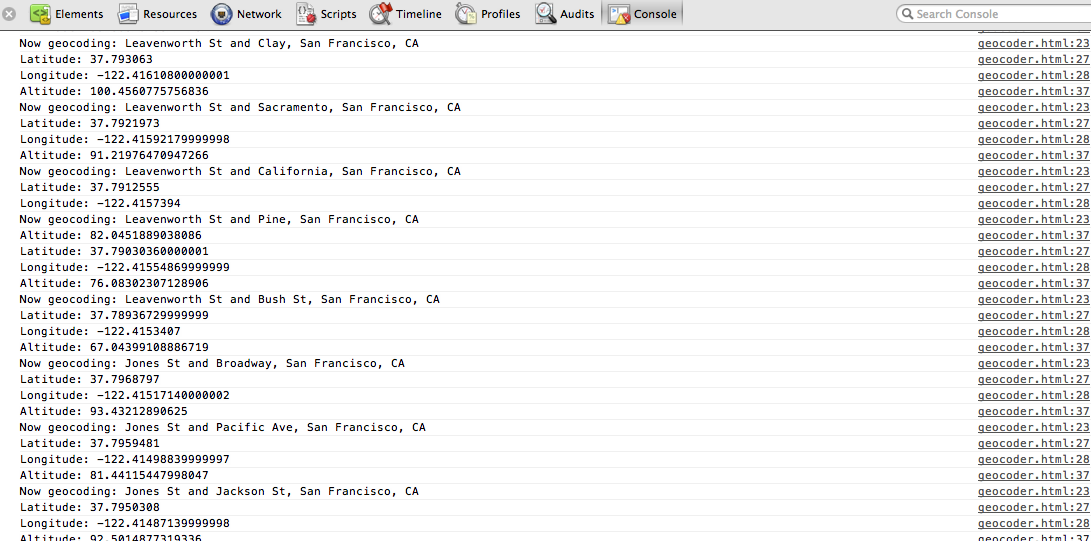
Here’s the client-side batch, running for real:
Compute the paths
Computing the paths is fairly easy once you have a structure like the one I have. The hardest part was getting the colors right. And for that I used http://mjijackson.com/2008/02/rgb-to-hsl-and-rgb-to-hsv-color-model-conversion-algorithms-in-javascript
Code to compute color for a given path:
      var computeHexColor = function(start, end) {
        // Given two points, compute the color of the path
        // Red means super steep, green means flat

        var distance = Math.sqrt(Math.abs(start.lat - end.lat)*Math.abs(start.lat - end.lat) + Math.abs(start.lng - end.lng)*Math.abs(start.lng - end.lng));
        var elevation = Math.abs(start.alt - end.alt);
        var slope = elevation/distance;
        if (slope > 16500) {
          /* Sanity check*/
          slope = 16500;
        }

        var normalizedSlope = slope/16500; // varies from 0 to 1. Woo!

        // Green is 1/3, 1, 0.5 in HSL
        // Red is 0, 1, 0.5
        // So we make the hue vary from 0 to 1/3. Nothing fancy.
        var rgbColor = this.hslToRgb(0.6*(1-normalizedSlope), 1, 0.5);
        var hexColor = '#' + this.rgbComponentTohex(rgbColor[0])
            + this.rgbComponentTohex(rgbColor[1])
            + this.rgbComponentTohex(rgbColor[2]);

        return hexColor;
      };
Result
After some amount of data cleaning (Google’s geocoder is sometimes not accurate, see how sloppy Geary is!) the final result is available in the labs section. It’s not over (I’m lazy and I have not finished all parts of SF yet) but it gives you a pretty good idea of where hills are when walking in the popular north eastern part of the city.
Further reading
-
Old article but really cool read (at least that’s what I thought): http://www.datapointed.net/2009/11/the-steeps-of-san-francisco/
The result visualization seems extremely accurate: http://www.datapointed.net/visualizations/maps/san-francisco/streets-slope/ -
Hillmapper: same idea but executed better. Props to Samuel Maurer (@smmaurer)