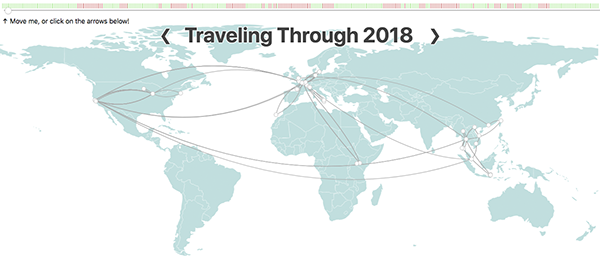
Traveling Through 2018
This small app/website is a simple visualization of the traveling
accomplished in 2018. To make things a bit interesting I tried to reduce
the use of frameworks and libraries to a bare minimum.
The background world map is generated from raw, open data from NaturalEarthData. The data is stored in a Google
spreadsheet, and pulled at build time though a simple Python script (which
uses Google's API). The visualization itself is based on barebone HTML. The
styling is done through CSS, and the interactivity comes from SVG,
JavaScript and SMIL.
Special care has been given to browser compatibility and progressive
enhancement. Even if your browser/device doesn't support SVG at all you
should still be able to see a table with the raw data. Better than a blank
page don't you think? Feel free to take a look at the code here on Github.
- Design:
- In-Browser
- Coded with:
- Vim/Devtools
- Architecture made of:
- HTML, SVG, SMIL, & JavaScript